
Process Data
- Table of Contents
I. Goals
To make the concepts in our workflow concrete, we use expression data from a study by Myron G. Best and colleagues (Best 2015). Their aim was to differentiate blood platelets from healthy donors to those diagnosed with a malignancy towards a proof-of-principle for blood-based cancer diagnosis.
By then end of this discussion you should (Figure 1):
- Be familiar with the efforts by Best et al. to find RNA signatures of cancers within platelets
- Be aware of procedures used to determine differential expression from RNA sequencing output
- Download a set of files that are dependencies for subsequent workflow steps
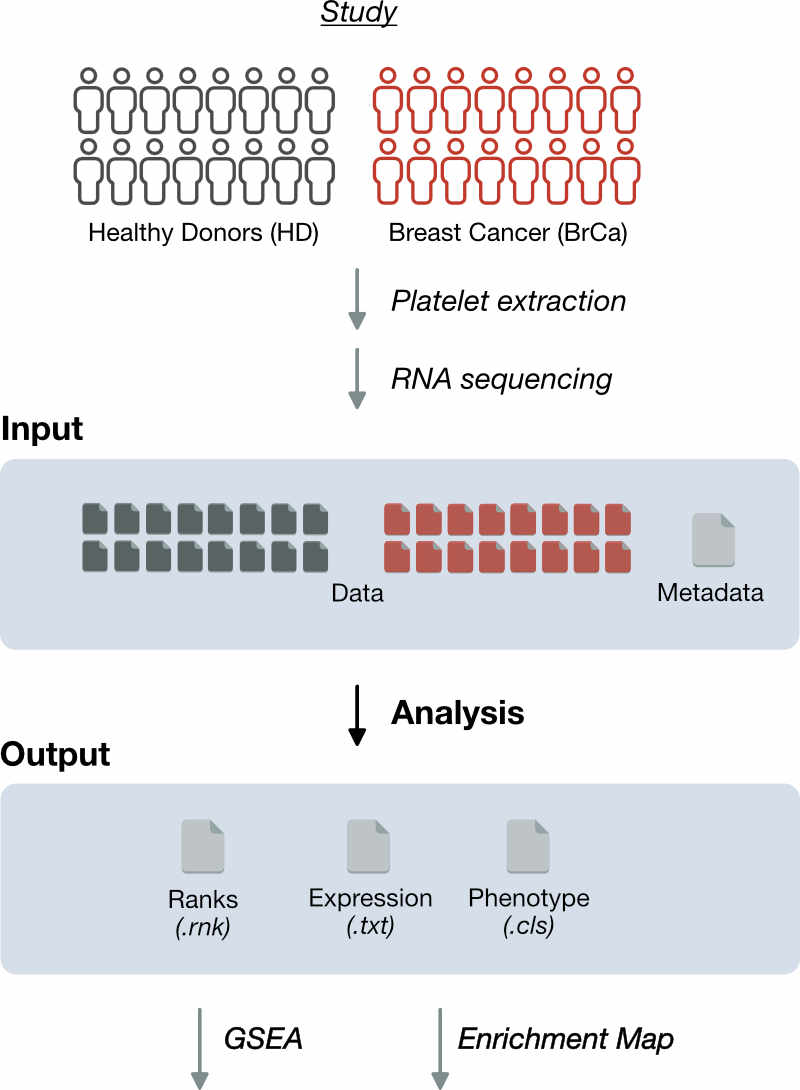
Figure 1. Goals. To illustrate construction of an Enrichment Map, we follow the work done by Best et al. (Best 2015) comparing RNA-Seq profiles of platelets from healthy donors (HD) to those with breast cancer (BrCa) with the goal of defining blood-based diagnostic signatures. We will provide a brief overview of the study and describe the methods used to generate RNA-Seq profiles from platelet samples. In this workflow step, we use the RNA-Seq data and sample class metadata as inputs and perform a differential expression analysis for each gene. The output of this step are files which are the dependencies for subsequent workflow steps. Besides downloading these files and understanding what they contain, there is no further action to be taken in the workflow.
II. Background
This workflow is framed using sample data from a study by Best et al. who developed aimed to provide a proof-of-principle for platelet-based cancer diagnosis. We briefly review this and related material in this section.
Blood-based cancer biopsies
Cancer surveillance would be greatly aided by practical, low-cost alternatives to support early-detection, diagnosis, and treatment decisions. Ideally these tools would be non-invasive yet retain the sensitivity and accuracy needed to reliably differentiate between normal and pathological states. Blood-based biomarkers have been aggressively pursued as a means to diagnose malignancies. The components of blood that have been examined include both cell-free molecules (e.g. DNA, RNA, proteins) along with immune cells (monocytes, platelets) (Figure 2).
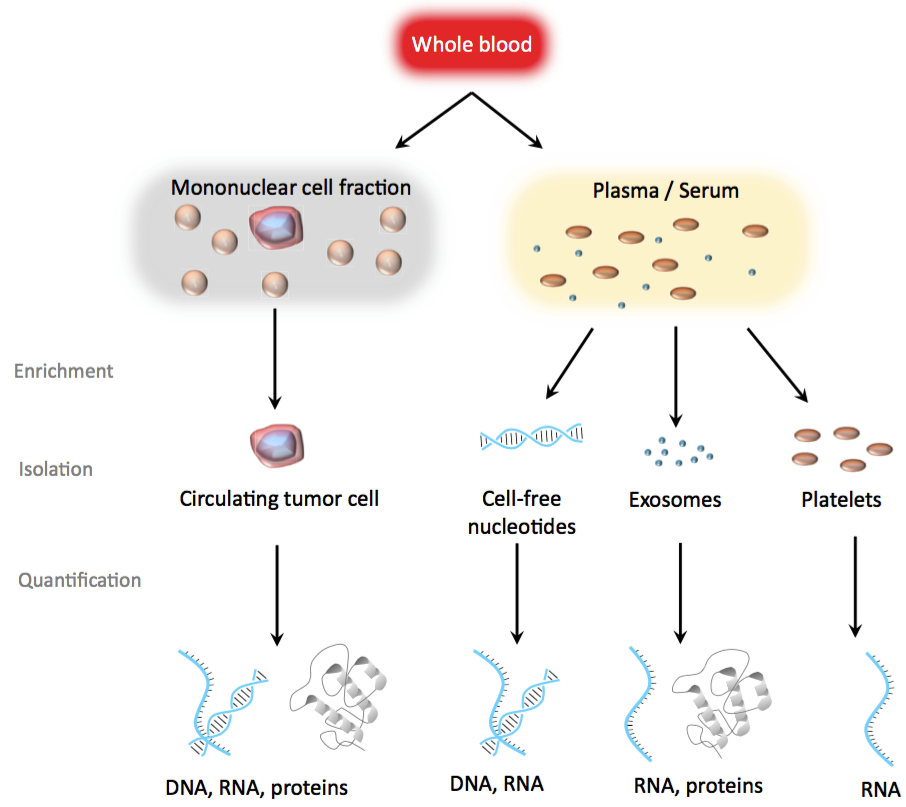
Figure 2. Blood-based cancer biopsies. Blood can be separated into different fractions in order to enrich for tumor-associated biomarkers. From the mononuclear cell fraction, circulating tumor cells (CTCs) may provide genomic, transcriptomic, and proteomic information on the tumor. From plasma or serum, cell-free nucleotides and exosomes can be further used to interrogate cancer-secreted bioparticles. Adapted from Joose et al. (Joose 2015), Figure 1.
A platelet primer
Within the marrow, platelets originate as cytoplasmic fragments of megakaryocytes which ‘bud-off’ into the circulation via shear forces generated by circulating blood. Approximately 1 trillion platelets circulate an adult human at any one time making it the second most abundant cell type in blood. The primary physiological role of platelets is to sense and accumulate at the sites of damaged endothelial tissue and initiate a blood clot to mitigate and vessel leakage (Semple 2011). Disruption of the integrity of the endothelium exposes extracellular molecules that signal adhesion of platelets which, in turn, secrete a host of molecules and cytokines that recruit additional platelets to form the initial hemostatic plug.
Platelets are far from simple vestibules of biomolecules. An increasing body of research supports an active role for platelets in modulating innate and adaptive immune responses and a direct involvement in pathologies such as sepsis, atherosclerosis and rheumatoid arthritis (Semple 2011). In particular, the immune regulatory role of platelets arises from receptor-mediated interactions with pathogens, neutrophils and antigen-presenting cells.
Although anuclear, it has been shown that platelets are neither inert nor homogeneous. At the transcript-level, circulating platelets have been shown to possess functional splicing apparatus that is triggered in response to external activation (Denis 2005). At the protein-level, platelets possess a fully functional translation apparatus and its proteome has been described as a ‘fluid’ of components that rapidly alters depending on the conditions (Lindemann 2007). Thus, platelets are subject to many common aspects of gene regulation in order to sense and respond to their environment.
Platelet ‘education’ in cancers
The pathogenesis of cancer requires the cooperation of a host of stromal and immune cells termed the tumour microenvironment. Indeed, a variety of immune cells that normally suppress cancer are coopted by tumours to enable evasion of immune surveillance in a process termed ‘education’ (Quail and Joyce 2013). One mechanism of heterotypic signalling involves shedding of exomes by cancer cells containing pro-tumourigenic and pro-metastatic factors.
Platelets have been implicated in aiding and abetting the metastatic potential of cancer cells through a variety of routes (Gay 2011) (Figure 3). First, they aggregate in order to shield cancer cells that have entered the vasculature from immune cell recognition. Second, they facilitate their extravasation by enabling cancer cell to arrest and adhesion at points in the vasculature. Third, platelets secrete variety of molecules that support cancer cell survival and promote endothelial permeability, further promoting their extravasation.
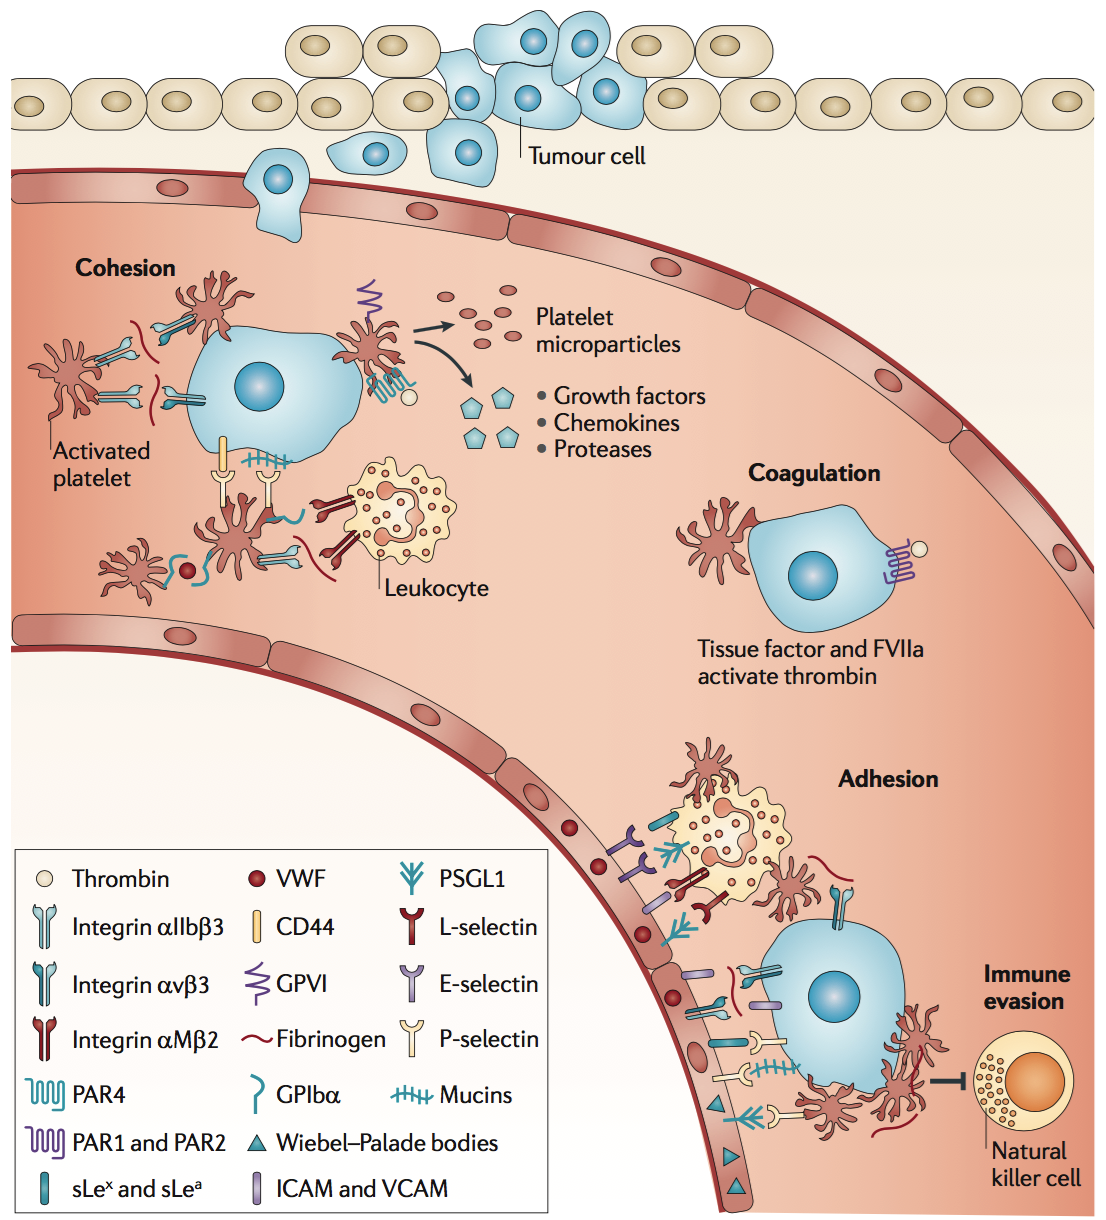
Figure 3. Molecular coordination between platelets and tumour cells supports metastasis from the bloodstream. As platelets become activated, they undergo a shape change, increase their adhesiveness, release granules and microparticles, and perpetuate the cohesion of heteroaggregates containing tumour cells, platelets and leukocytes. Platelet granules contain growth factors, chemokines and proteases. During cohesion, circulating tumour cells can interact with activated platelets and leukocytes, and form heteroaggregates that support attachment to the endothelium and thereby contribute to metastasis. During adhesion, initial, transient adhesion is followed by firm attachment that is mediated by integrins and intercellular cell adhesion molecules. During immune evasion, multivalent plasma proteins form intercellular bridges, and activated platelets and fibrinogen protect tumour cells from natural killer cell lysis during haematogenous metastasis. GP, glycoprotein; icAM, intercellular adhesion molecule; PAr, protease-activated receptor; PsGL1, P-selectin- glycoprotein ligand 1; sLea, sialyl Lewis a antigen; sLex, sialyl Lewis x antigen; vcAM vascular cell adhesion molecule; vWF, von Willebrand factor. Adapted from Gay et al. (Gay 2011), Figure 2.
The close contact between cancer cells and platelets results in their ‘education’. For example, tumour-associated RNA (e.g. EGFRvIII in brain and PCA3 in prostate) could be detected in platelets (Nilsson 2011) and is consistent with observations that tumor exomes could be taken up by platelets.
RNA-Seq of tumour-educated platelets (TEM)
The evidence indicating that platelets have intimate contact with cancer cells, take up exome-derived RNA, demonstrate differential splicing in response to their environment and their abundance in blood supports the notion that they may possess a large degree of heterogeneity. Such diversity could be clinically relevant if they enable discrimination between different stages of a malignancy. Best et al. set out to determine just how much diagnostic ‘information’ is contained in platelet transcriptomes.
Sample collection
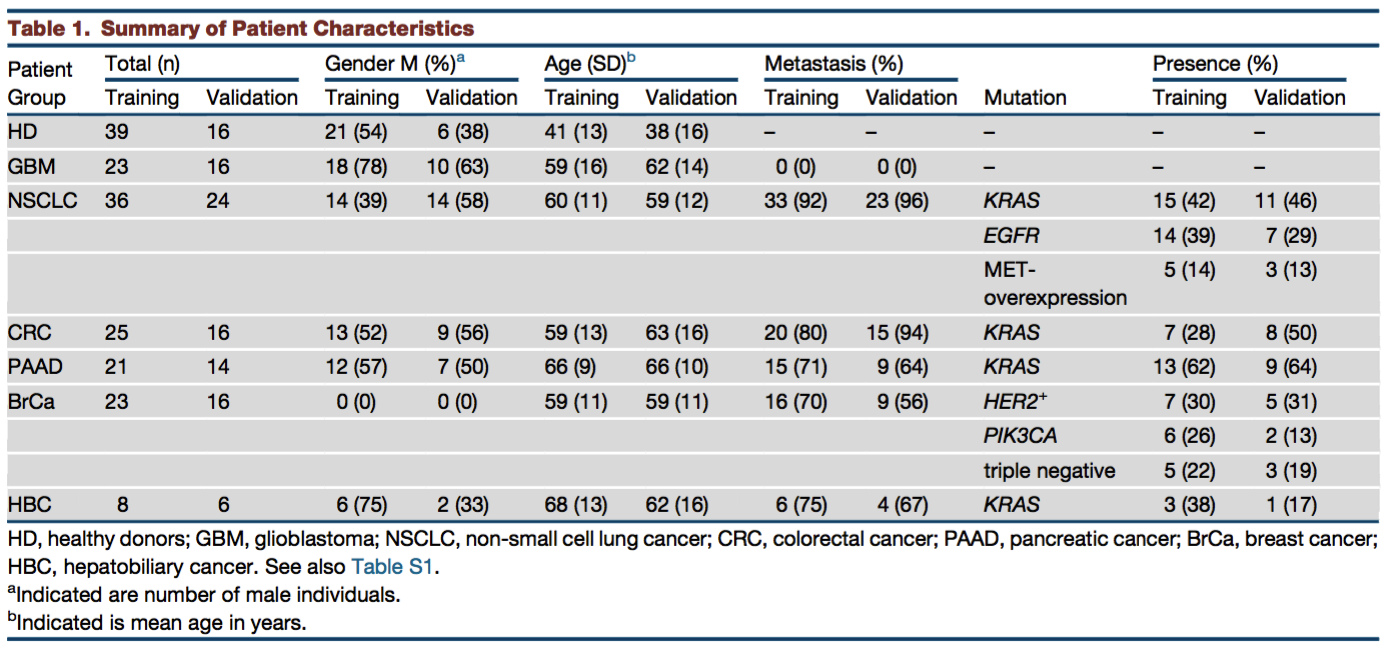
Best et al. prospectively collected blood platelets from 55 healthy donors (HD) and from 189 treated and untreated patients with cancers at varying stages (Table 1). In particular, 39 of these were from breast cancers (BrCa) which will be the focus of our workflow.
Table 1. Summary of Patient Characteristics Adapted from Best et al.
RNA sequencing and analysis
Figure 4 depicts the sample collection and processing scheme. For each patient, approximately 100-500 picograms of total platelet RNA - the equivalent content in less than a drop of blood - was extracted for sequencing.
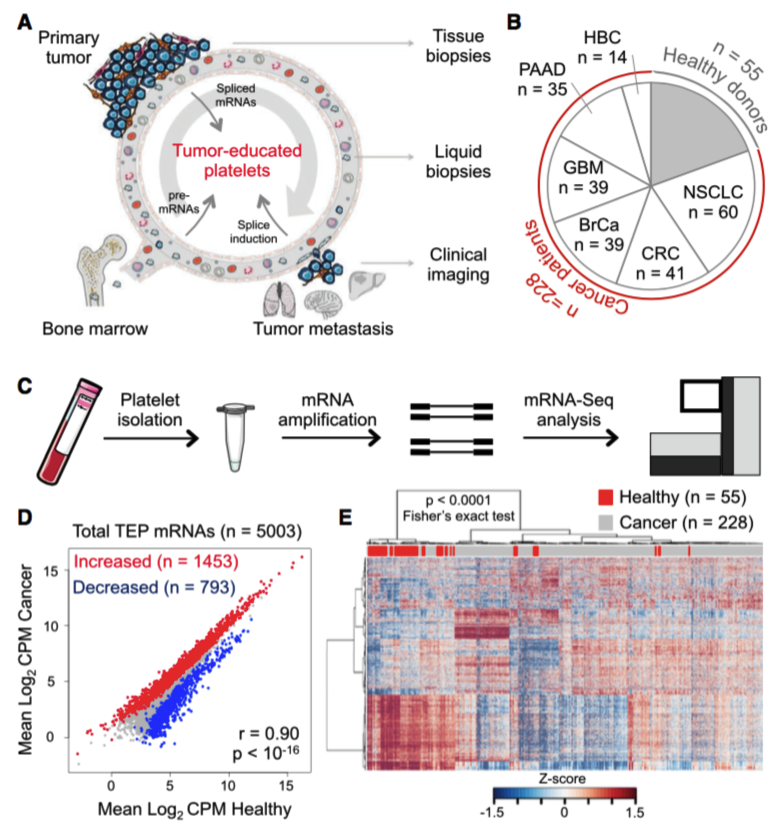
Figure 4. Sample collection and RNA sequencing. (A) Schematic overview of tumor-educated platelets (TEPs) as biosource for liquid biopsies. (B) Number of platelet samples of healthy donors and patients with different types of cancer. (C) TEP mRNA sequencing (mRNA-seq) workflow, as starting from 6 ml EDTA-coated tubes, to platelet isolation, mRNA amplification, and sequencing. (D) Correlation plot of mRNAs detected in healthy donor (HD) platelets and cancer patients’ TEPs, including highlighted increased (red) and decreased (blue) TEP mRNAs. (E) Heatmap of unsupervised clustering of platelet mRNA profiles of healthy donors (red) and patients with cancer (gray).Adapted from Best et al. (Best 2015), Figure 1.
Since Best et al. were interested in the discriminatory capacity of transcriptomes, they initially filtered RNA species for those that were intron-spanning and had sufficiently high expression counts (>5) to reduce the amount of noise.
A reduced set of 5 003 protein and non-coding RNAs (excluding Y chromosome and mitochondrial) were used in a pair-wise comparison of expression between HD and pan-cancer samples. Across all cancers the authors identified 1 453 and 793 RNAs with increased and decreased representation, respectively (Figure 4D). These differentially expressed genes were sufficient to discriminate HD and cancer-derived platelets (Figure 4E).
Breast cancer diagnostics
Is the information in platelets sufficiently informative to discriminate between healthy donors and those with breast cancer? To determine this, the authors first performed a clustering analysis to extract a subset of RNA species (n = 192) with discriminatory power then fed these genes into a machine learning algorithm trained to assign the correct category for each sample. In this case, the authors reported a 100% test accuracy in discriminating platelets derived from normal versus breast cancer patients (Figure 5).
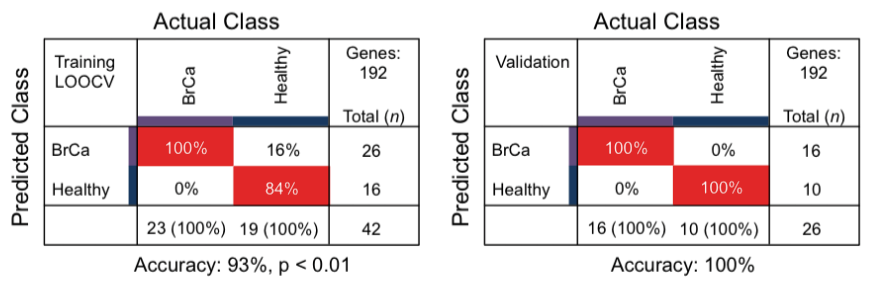
Figure 5. Sample classification accuracy and sensitivity. Cross table of Support Vector Machine algorithm diagnostics with healthy donor subjects and BrCa. Unique tumor-specific gene lists were determined and used to train the different algorithms. For the BrCa-classifying algorithm, only female healthy donors were included. Indicated are sample numbers and detection rates in percentages. Accuracy performance for each algorithm is indicated below the cross table. Adapted from Best et al. (Best 2015), Figure S2C.
Zooming out: Pathway analysis
That such a plentiful and accessible material could provide the basis of an astonishingly accurate classification scheme is an exciting achievement and lends support for blood-based cancer diagnostics. We can repurpose the same RNA measurements to probe deeper into the biology of the platelets themselves.
Let us revisit two points raised earlier:
- Platelets play an active and important role in the physiology of cancer
- Platelets are functional cells that modify gene expression and behaviour in response to environmental stimuli
While a list of genes expression differences with exquisite discriminatory power for breast cancer diagnosis is useful per se, we can go a step further: What biological processes distinguish platelets from and healthy and diseased patients? In other words, we wish to better understand how those differences in RNA species might underlie various pathways inside a cell. What does the transcriptomic data really mean?
III. Workflow Step
In this workflow step, we will walk through the transformation of RNA sequencing data counts generated by Best et al. for platelets from 16 HD and 16 BrCa patients into three output files that are dependencies for later steps:
-
Rank file
- This file will be required for a workflow step ‘Identify Pathways’ where changes in gene expression are summarized as pathways (Figure 1; Step 2)
- This file is a RNK table where each row contains a gene name followed by its ‘rank’ which is inversely correlated with the value of the differential expression testing p-value.
-
Expression file
- This file will be used in the final workflow step ‘Visualize’ so that we can view the gene expression heatmap associated with any pathway
- This file is a TXT table where columns are normalized RNA counts for different biological samples.
-
Phenotype file
- This file will be used in the final workflow step ‘Visualize’ so that we can differentiate (i.e. colour) those pathways ‘up-regulated’ in HD versus BrCa samples (Figure 1; Step 3)
- The CLS format contains information about the sample classes (aka ‘condition’, ‘phenotype’) and assigns each sample to one class.
Input
RNA-Seq files and metadata
In this workflow, we will be focusing on a subset of 16 BrCa and 16 HD samples. Table 2 shows an excerpt of RNA-Seq output for one biological sample: The first column indicates the gene identifier (Ensembl) and the second column indicates the mapped sequence read count for that RNA species.
Table 2. Sample high-throughput RNA sequencing counts
| ENSG00000000003 | 0 |
| ENSG00000000005 | 0 |
| ENSG00000000419 | 100 |
| … | … |
| ENSG00000273493 | 0 |
We also provide a tab-delimited metadata file (tep_phenotypes.txt) that contains the name (id) of each RNA-Seq file and its corresponding class (Table 3).
This metadata file is something that would not be provided by a sequencing facility but would be simple to create in a text editor or Excel.
Table 3. Contents of metadata file
| id | class |
|---|---|
| MGH-BrCa-H92-TR472_htsqct.txt | BrCa |
| MGH-BrCa-H89-TR471_htsqct.txt | BrCa |
| MGH-BrCa-H84-TR551_htsqct.txt | BrCa |
| … | … |
| HD-18-2_htsqct.txt | HD |
Analysis
With our RNA-Seq count files and metadata in-hand, the true work involved at this stage is assigning a rank to each RNA species that based on some measure of differential RNA expression. Rather than provide a detailed discussion of the concerns surrounding differential expression testing, we provide a thumbnail sketch of the tasks involved in achieving this goal.
We refer the reader to our primer on RNA sequencing analysis for a detailed description of the theory underlying the processing steps described here.
1. Data wrangling
Getting the data into the format that is useful for downstream analysis is an important but often under-appreciated aspect of computational biology research. In this case, there are three tasks that we must accomplish with our data and metadata.
First, we must integrate or ‘merge’ the 32 RNA-Seq files together into a single table. The reason for this is that data in table format is a form that is more easily loaded into RNA-Seq analysis software packages. Typically, sequencing facilities often provide individual files for each RNA-Seq sample similar to that in Table 2, but mileage may vary depending on your particular facility.
Second, we must perform gene identifier mapping. This entails translating the names of genes provided within the raw RNA-Seq files into a desired namespace. This is necessary because the enrichment software that distills pathways from gene expression must be able to match RNA counts for a gene with those in candidate pathways.
Third, our metadata file is sufficient to generate our phenotype file (Table 4), which declares the number of samples and classes (row 1), names the classes (row 2) and then declares the class to which each sample belongs (row 3). Since our metadata contains the name (id) of the sample and the class, this is a simple task.
Table 4. Phenotype output (.cls file)
| 30 | 2 | 1 | … | ||
| # | HD | BrCa | … | ||
| HD | HD | HD | … | BrCa | BrCa |
2. Filtering
Biological processes are inherently noisy (Raser 2005) and the same goes for gene expression. Some of this gene expression noise arises from the stochastic nature of biochemical reactions which are rather pronounced when dealing with small numbers of molecules.
In practical terms, RNA species with very low mapped read counts in a small number of samples can be highly variable. Consequently, we choose to ignore these in the search for differential expression. Best et al. use the rule of thumb that ‘genes with less than five (non-normalized) read counts in all samples were excluded from analyses’.
3. Normalization
RNA for a sample can be sequenced to varying ‘depths’. This means that the total number of sequence reads mapped to a gene for an individual sequencing run is not necessarily constant. The reason for this lies in the nature of next-generation sequencing technologies. Nevertheless, what most concerns us is not the absolute counts of an individual RNA species coming out of a sequencing run but rather the proportion. In practical terms, we desire a fair-comparison of RNA counts between samples that takes into account variation in depth.
Over the years, several approaches have been proposed to account for varying depth in RNA-Seq outputs (Oshlack 2010). Our recommendation is to use a normalization technique called Trimmed mean of M-values (TMM; Robinson & Oshlack 2010) that effectively standardizes counts between distinct sequencing runs by assuming that most genes are not expected to alter their expression.
At this stage, we can generate an expression file of normalized RNA counts where row names are gene symbols and column names are sample IDs (Table 5).
Table 5. Expression output (counts per million mapped reads)
| NAME | DESCRIPTION | MGH-BrCa-H92-TR472_htsqct | … | Breast-60_htsqct |
|---|---|---|---|---|
| PPP1R2 | PPP1R2 | 20.0960199625179 | … | 21.2351177118648 |
| STARD7 | STARD7 | 9.80293656708189 | … | 0 |
| TDP2 | TDP2 | 35.2905716414948 | … | 89.9369691326038 |
| … | ||||
| ANAPC13 | ANAPC13 | 1.47044048506228 | … | 1.24912457128616 |
4. Differential expression testing
In this stage we perform a pair-wise comparison of RNA species counts in BrCa samples relative HD samples. The framework used to determine differential RNA expression is a hypothesis-testing technique that entails the following:
- Declare the null hypothesis of no difference in RNA counts for each gene
- Define a null distribution that describes how RNA counts vary under circumstances where there is no association between RNA counts and class
- Calculate the probability (p-value) of observing a difference in RNA species counts at least as extreme as the one observed assuming the null hypothesis/distribution
At this stage, we can generate a rank file where row names are gene symbols and a single column indicates the rank calculated as a function of their p-value. The larger the magnitude of the positive or negative rank, the rarer such an observation would be under the assumption of no association between class and RNA count (Table 6).
Table 6. Rank output
| gene | rank |
|---|---|
| ARHGAP45 | 58.1795999084575 |
| NCK2 | 50.6627080327017 |
| TRIM58 | 50.6246427495811 |
| … | … |
| MDM4 | -27.685318540466 |
Output
Listed below are the outputs of this step that will be required as input dependencies for the next steps of the workflow.
Dependencies for GSEA (Workflow Step 2: Identify Pathways)
- Ranks
- Genes ranked as a function of p-value from differential expression. Ranks (.rnk)
Enrichment Map dependencies (Workflow Step 3: Visualize)
- Expression
- Normalized counts for RNA species in for each sample. Expression (.txt)
- Phenotype
- Declaration of classes and sample assignment. Phenotype (.cls)
References
- Best MG et al. RNA-Seq of Tumor-Educated Platelets Enables Blood-Based Pan-Cancer, Multiclass, and Molecular Pathway Cancer Diagnostics. Cancer Cell. 2015 Nov 9;28(5):666-676. doi: 10.1016/j.ccell.2015.09.018. Epub 2015 Oct 29.
- Denis MM et al. Cell. Escaping the nuclear confines: signal-dependent pre-mRNA splicing in anucleate platelets. 2005 Aug 12;122(3):379-91. doi: 10.1016/j.cell.2005.06.015.
- Gay LJ & Felding-Habermann B. Contribution of platelets to tumour metastasis. Nat Rev Cancer. 2011 Feb;11(2):123-34. doi: 10.1038/nrc3004.
- Joosse SA & Pantel K. Tumor-Educated Platelets as Liquid Biopsy in Cancer Patients. Cancer Cell. 2015 Nov 9;28(5):552-554. doi: 10.1016/j.ccell.2015.10.007.
- Nilsson RJ et al. Blood platelets contain tumor-derived RNA biomarkers. Blood. 2011 Sep 29;118(13):3680-3. doi: 10.1182/blood-2011-03-344408. Epub 2011 Aug 10.
- Oshlack A et al. From RNA-seq reads to differential expression results. Genome Biol. 2010;11(12):220. doi: 10.1186/gb-2010-11-12-220. Epub 2010 Dec 22.
- Semple JW et al. Platelets and the immune continuum. Nat Rev Immunol. 2011 Apr;11(4):264-74. doi: 10.1038/nri2956.
- Quail DF & Joyce JA. Microenvironmental regulation of tumor progression and metastasis. Nat Med. 2013 Nov;19(11):1423-37. doi: 10.1038/nm.3394.
- Raser JM & O’Shea EK. Noise in gene expression: origins, consequences, and control. Science. 2005 Sep 23;309(5743):2010-3. doi: 10.1126/science.1105891.
- Robinson MD & Oshlack A. A scaling normalization method for differential expression analysis of RNA-seq data. Genome Biol. 2010;11(3):R25. doi: 10.1186/gb-2010-11-3-r25. Epub 2010 Mar 2.